
WAT-E2090 - Water and People in a Changing World D, 20.04.2021-26.05.2021
Kurssiasetusten perusteella kurssi on päättynyt 26.05.2021 Etsi kursseja: WAT-E2090
Osion kuvaus
-
Theme lecture
The theme lecture is available at the following web-page:
Prezi presentation of the population dynamics
Presentation of the week, including the introduction to individual project work:
Weekly ppt, including Project work introduction
Hands-on exercise
For the hands-on exercise, we will provide you with a new demo script. All data was given already during the first week.
In the beginning of the hands-on session, we will fetch the demo script together. However, you can pull the demo script already before the session and browse it through if you'd like. If you'd like to watch a recap on how a git pull is performed, see the beginning of the first workshop recording below.
Video: pulling new changes (approx. 0:00-5:00)
Written instructions on how to update course material are given below.
- Open your project from the wp-course-2021.Rproj file
- In RStudio, select Tools -> Shell or use the "Terminal" tab next to the "Console" tab
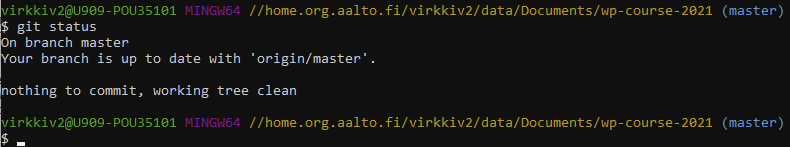
- Verify that the shell is in the wp-course-2021 folder. In Aalto VDI, the current directory of the shell is highlighted in yellow. If there's a cyan (master) tag after the path, the shell is in the correct directory. Changing directories can be done with the command cd path/to/directory.

- Commit any previous work according to the instructions in this video. The working tree should be clean as shown below. The output before the working tree can be "Your branch is XXX commits ahead of 'origin/master'" but that is expected and nothing special needs to be done for it.
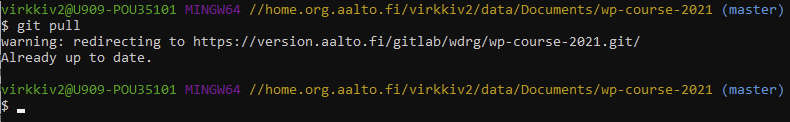
- Type git pull into the shell and press enter.
- The shell pulls the changes from the version control system to your folder wp-course-2021.
- If you pull again, you should get "Already up to date." which means that you're good to go.
Home assignmentDiscover global / regional / river basin population dynamics
Instructions:
- please select a research question below or develop your own (preferred!)
- produce one A4/A3 page with following structure: a) title; b) research question and short introduction; c) GRAPHS, maps, etc of the results with captions d) interpretation of the results
- you can get help to possible problems by a) searching from internet: there are many people with similar problems; b) posting question to the R Q&A channel in Teams; c) coming to Thursday workshop, or d) asking us or your fellow students directly
- once you are happy with the end result, please submit the work (see below Submission)
This weeks illustration type: bar and scatter plots; include either one to the home assignment! See example charts under 'Visualisation guides and examples' -tabExample research questions:
- what is the distribution of population in different precipitation and/or temperature zones and has this changed over time? Does that differ between urban and rural population?
- how far from fresh water sources people live today and has that changed over time or will it change in the future? Does that differ between urban and rural population?
- where do people live in relation to elevation and distance to coast? Does that differ between urban and rural population?
Submission: please submit the assignment by using the submission icon below.
Thursday workshopOn Thursdays we have a Zoom workshop in where you can get help on the home assignment and project work. At around 9:30, we'll give a short lecture on Adobe Illustrator to show how you can use it to enhance your vector graphs and make them visually appealing. The lecture is also given in the video below:
Illustrator video - part2 (from year 2020)
Illustrator tutorial - part 2 (from year 2021)
Video: cut raster with a polygon
-
Please submit the first assignment here; instructions are in the MyCourses page.
Please remember: submission is due on Monday 3.5. at 23:55 If you submit the assingment late, you'll get only half of the points. The submission will be closed completely on 10.5, after which you are not able to submit the assignment.
Before submission, please check:
- your home assignment fits to one page
- the format of the submission is pdf
- assignment includes either scatter plot (point scatter or line graph) or bar chart