
ELEC-E7130 - Internet Traffic Measurements and Analysis, 09.09.2020-30.11.2020
Kurssiasetusten perusteella kurssi on päättynyt 30.11.2020 Etsi kursseja: ELEC-E7130
Assignment 4: Analyzing data using R or python
Introduction
This exercise will cover the main topics related to importing, analyzing and visualizing data using R (or python). After completion of this exercise the students must have good understanding of available techniques and hands on experience in analyzing and visualizing the data.
With analysis it is important to know what numbers describe characteristics best and how to produce graphs that represent information in easy to understand way.
This assignment contains six tasks:
- Task 1: Understanding different plots
- Task 2: Plot data
- Task 3: Link loads
- Task 4: Pairs plot
- Task 5: Practising with dataframes
- Task 6: Understanding time series concepts
All these exercises can be done by R or any other available software (such as python, Matlab) as far as the result are consistent and correct.
All the data files required in this exercise are found from /work/courses/unix/T/ELEC/E7130/general/r-data directory. Path is also as RDATA environment variable if you have sourced the use.sh file.
Prerequisites
This exercise requires students have basic understanding of R and how to leverage R for performing different tasks including importing data, visualizing data, and inferring results from the data.
More information about R can be found from material section of course and of course around the Internet, for example:
- R Help
- R for programmers
- Python matplotlib and e.g. mathplotpib for data sceince
Task 1: Understanding different plots
Explain briefly the following plots. For example, what do their y-axis/x-axis represent, how to interpret the plot, and/or the purpose of the plot.
- Boxplot
- Parallel plot
- Lagplot
- Autocorrelation plot
Report, task 1:
- Discussion on different plots.
Task 2: Plot data
In this task, you will plot various kinds of plots in linear scale and logarithmic scale, and then analyze them.
File flows.txt contains values of flow lengths in bytes captured from a network. Download the file and study the flow length variable using your favorite software. Provide concise answers to the following sections.
Plot the flow data using:
- Scatterplot (Number of observation will reside on X axis)
- Histogram (Using suitable number of bins)
- Boxplot
- Empirical CDF of the variable
Note: You need to provide the plots and also commands used to plot the data in your report.
Describe (summarize) the distribution of the variable using:
- One number
- Two numbers
- Three numbers
Note: You need to provide the commands you used to get the results and also explain the reasons for your selections based on the information you gathered during the previous section.
Replot data using logarithmic values and explain why and when is it more suitable to use the logarithmic values?
Report, task 2
- Different plots of
flows.txt - Summarize distribution using different number of variables
- Different plots of
flows.txtusing logharitmic values - Conclusions based on the flow information, what are the best methods to describe the data?
Tips: Useful R functions could be plot(), hist(), boxplot(), ecdf(), log().
Task 3: Link loads
In this task, you will produce different kind of plots that could be useful for analyzing network data.
Files linkload-*X*.txt contains link loads information (in bits per second) of different links in intervals of one second.
- Create time plot, lag plot (lag-1) and correlogram ( i.e. autocorrelation plot) of each link.
- Inspect the data especially for stability and whether previous values contribute to the present value (short and long range memory).
- Explain your own understanding about each data set.
Tips: Useful Python functions could be lag_plot(), autocorrelation_plot(). Useful R functions could be lag.plot(), acf().
Report, task 3
- Plots according to instructions
- Data inspection results
- Conclusions of each data set.
Task 4: Pairs plot
The bytes.csv dataset contains time series data of 4 relevant columns: transmitted bytes, received bytes, transmitted packets, and received packets. Answer the following questions (no need to return code).
Plot the pairs plot for such values. Which variables correlate most to each other?
Let’s assume that you decide to remove one particular column to reduce computation load of data handling. Based on the pairs plot, what would the column be, and why?
Tips: Useful Python function could be scatter_matrix(). Useful R function could be pairs().
Report, task 4
- Pair plots and analysis.
- What is the least informative column and why?
Task 5: Practising with dataframes
In machine learning, empty values need to be dealth with. In addition, in case of supervised learning, the data must be somehow labeled if it wasn’t already.
flowdata_unclean.txt contains flow data which was acquired by using CoralReef on captured .pcap files. It contains 11 columns, including bytes-column. However, the dataset contains some empty values (NaN values) in some cells, and it is missing labels. Write a program to perform the following tasks.
Clean
flowdata_unclean.txtdataset by dropping all instances (rows) that contain NaN values.Add an additional column (12th column) to the end of the dataset. The values of this column are 0 if the number of bytes is less than 50, or 1 if more than 50.
Initially, the dataset looks like
              src  ...         first        latest
0  203.246.146.19  ...  1.491970e+09  1.491970e+09
1  203.246.146.19  ...           NaN           NaN
2  176.52.159.166  ...  1.491970e+09  1.491970e+09
3  203.246.146.19  ...  1.491970e+09  1.491970e+09
The new cleaned would look like
              src  ...         first        latest    Y
0  203.246.146.19  ...  1.491970e+09  1.491970e+09  0.0
2  176.52.159.166  ...  1.491970e+09  1.491970e+09  0.0
3  203.246.146.19  ...  1.491970e+09  1.491970e+09  0.0
Tip: Useful Python functions could be to_numpy()/values, dropna(), assign() (from panda’s library). This is also a task that is suitable
Report, task 5
- Describe method you used to clean the data and added the additional column.
- Provide code and sample of data.
Task 6: Understanding time series concepts
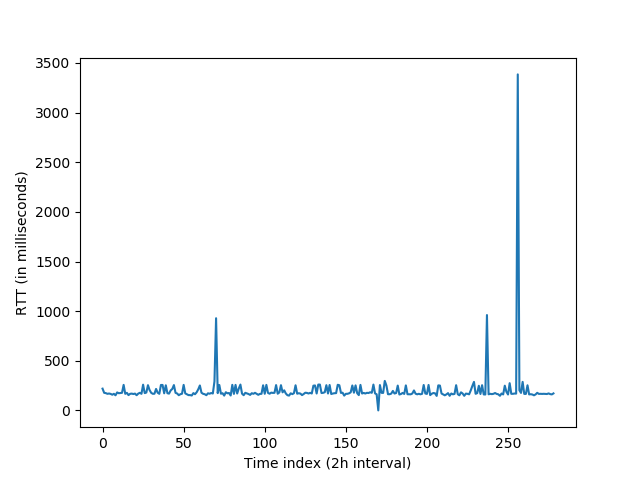
The following plot shows round trip times to distant website which server is located in Hawaii. By just looking at the plot, answer the following questions.
- Is there any trend or seasonality?
- Is the time series stationary?
Report, task 6
- Answer to questions with reasoning.
- 1. syyskuuta 2020, 16.03