
TU-E5040 - Product Management D, Lecture, 4.9.2023-12.10.2023
Kurssiasetusten perusteella kurssi on päättynyt 12.10.2023 Etsi kursseja: TU-E5040
Osion kuvaus
-
Purpose and style
The course includes seven assignments, one on each week plus one at the very end. Each assignment ties to the theme of the week, typically asking you to apply or deepen the concepts. Completing the assignment requires familiarising with weekly readings and lectures and also to materials addressing specifically the aspects of the assignment.
Audience and tone
In each assignment, you need to make decisions about both the content and the tone. The content is typically clearer, as each assignment provides a tasks, objective, and some step-by-step guidelines for completing it. However, the tone and the assumed audience tends to be more implicit decisions, and if you choose them consciously, you can avoid some default templates.
Form all assignment with the assumption that you aim to communicate your main point (about the assignment) to some relevant audience. This audience depends on the context. E.g. in terms of definition of development slices it would be the development team, and for product strategy, the audience could be a group of product managers, or top management team. With this you can focus on the key results of your assignment, stick to most important aspects, and choose the format and content according to the audience and the usefulness of your results. You can leave out all types of writing and content for which the only purpose is to show that you know something.
For the purposes of completing the course assignment, we can assess knowledge and expertise regardless of the format. However, if you merely report your knowledge, you miss out the opportunity to hone your skills for targeting and presenting your key points in a manner that can lead others to coordinate their decisions better. This is relevant with product and elsewhere.
Style
Assignments contain usually multiple elements and steps that are essential to the completion. However, the results are (typically) presented as a single graph, figure, or illustration. This requires a visual format that illustrates the relationships but also gives a fair amount detail on tasks and competences. Potential format are tables, annotated organization charts, well-organized mind maps, self-made illustrations, and such (below are few crude examples). In all, the focus should be on clarity and legibility. Use e.g. Powerpoint, Miro, MindManager, drawing apps, or similar. Depending on the skill level, some students have used Illustrator, Figma, and similar, but
excel, powerpoint, and clear pen-and-paper drawings work very well, too.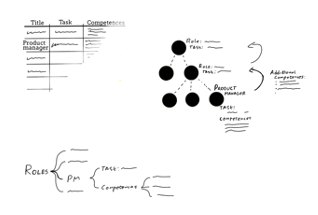
Once the results have found their format, report them in a very concise manner. Typically the requirement is one page, which is occasionally extended to two pages. Once you start doing the assignment, you probably notice that without graphical aids, it will be very hard to fit the results on a single page, if the content is just text.
Submission and grading
Assignments become available at the beginning fo each week. The DL for each weekly assignment is the following Monday (23:59 PM). NB! The DL is strict. Assignments are checked by the Wednesday, 16:00.
None of the assignments is required, but each completed assignment is worth 2 points in course grading.
Assignment are evaluated with pass/fail: If assignment is completed, it's a pass, and you get two points toward your grade.
Failed assignments can be resubmitted: If the assignment doesn't pass on the first try, you can resubmit it by next Friday, 23:59. Assignments are checked by the end of Wednesday, leaving you two days for the iteration and resubmission. Resubmitted assignments are graded on scale 0/1/2, depending on the quality of your revisions.
Late submissions: If the assignment is late less than 24 hours, the maximum available points for the assignment is reduced to one. After this, the assignment is not graded at all. Also, with late submissions there's no second chance to resubmit if failed. What counts, is the recorded timestamp of the submission in MyCourses, with no exceptions.
-
-
-
-
A4: Roles and Competences of Product Management Tehtävä
-
A5: Product Capabilities Tehtävä
-
Opiskelijoiden täytyyPalauta
THE TASK
Form an organised presentation of the PM tools (frameworks, processes, metrics, etc) from the perspective of key tasks of a product manager.
THE OBJECTIVE
This is the first of the two concluding assignments. The prior weeks have introduced multiple frameworks, tools and metrics. These tools and metrics have their ranges and focuses, and the specifics of the product, organization, and industry call for different approaches.
The task for the week is to take stock of the key tools and ideas presented so far, select a perspective, and form an organizing framework that charts both the key tasks of a product manager and incorporates the key tools and metrics to this framework. It will have a dual role of acting both as a backward-looking summary of the course topics and a forward-looking map for interpreting and navigating the competence development.
THE TASK IN STEPS
- Identify topics. Collect and take stock both the key tasks of PMs (use the earlier assignment as a basis) and the tools, metrics, frameworks, processes, and such that you have come across during the course (or earlier). Focus especially on the lectures, masterclasses and the key readings, but you are welcome to include also additional materials if you wish.
- Identify and form organizing dimensions. Analyse, categorise, and summarize the topics and notes that you identified in step 1. Try and find categories and dimensions that would organize your notes into a framework. For this, you can analyse e.g., what aspects and characteristics of product, organization, industry, technology, and such seem to influence what is the role of product manager? Or what tools and metrics are common to the whole field of PM and which of them are relevant to only some flavours of it? The key is to find underlying dimensions (or drivers) that seem to give structure to the key topics that you have identified[1].
- Form a framework. Based on the topics (step 1) and dimensions (step 2), form a single framework that organizes your insights and observations. This step should result into a presentation that illustrates how the topics relate to each other according to the identified dimensions.
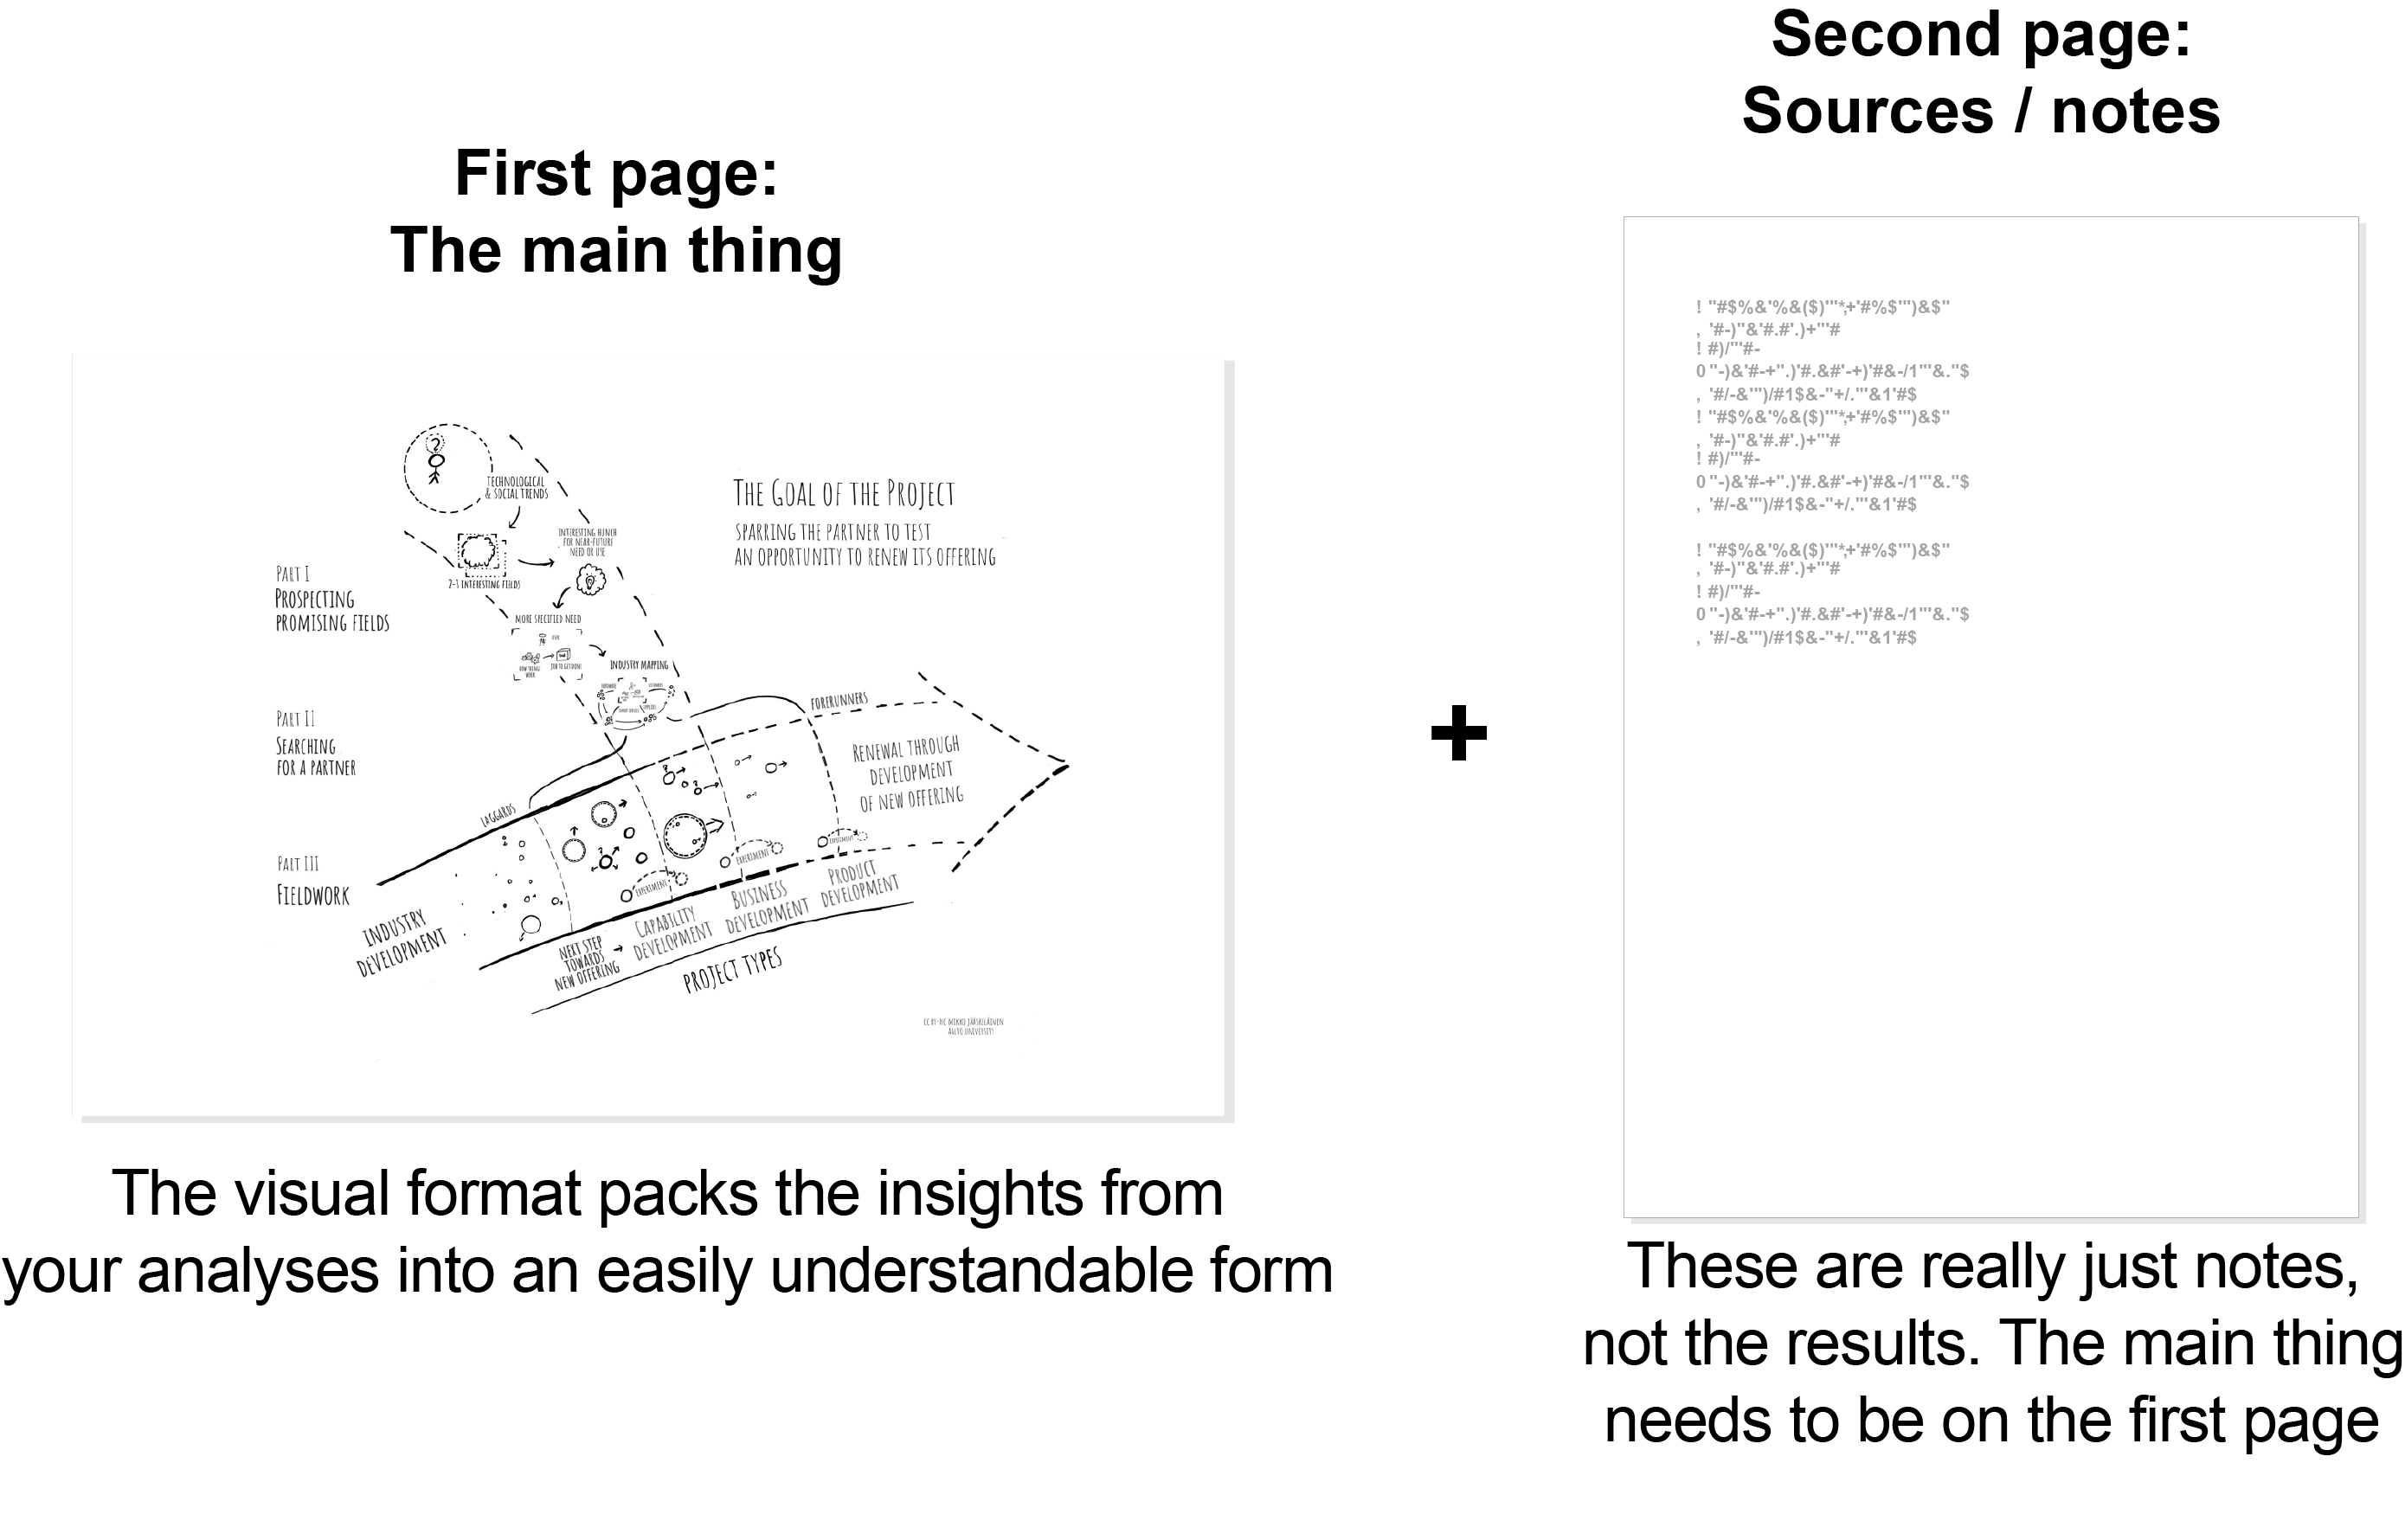
- Report the results. Use a dominantly visual format. This does not exclude text, but the text cannot define the overall visual layout and flow of the reporting. The positioning of visual elements on the report need to convey meaning about their relations (e.g., conceptually separate ideas are placed a part, distance means larger separation, connecting line or positioning within shared border denote connection between topic, and so on.)
- Return as a single pdf-file. Again, use a minimal number of pages (a single page would be splendid). In all cases, the first page should present the main framework. As the focus is on visual reporting format, the second page can add only very minor detail, categorize sources, or such.
[1] A simplistic example of this step: If you were to examine electric scooter, you might notice after some digging, that they are not all the same. Instead, there’s some design aspects that seem to separate different scooter, e.g., weight and range. Using these, you could form a two-by-two matrix, and categorize the scooter to e.g., “touring” (heavy with range) or “commuter” (light with reasonable range). Such framework is by no means final, and within the weight-range matrix, there could be sub-segments (e.g., “foldable, light commuters” separated from “entry-level commuters”).
- Identify topics. Collect and take stock both the key tasks of PMs (use the earlier assignment as a basis) and the tools, metrics, frameworks, processes, and such that you have come across during the course (or earlier). Focus especially on the lectures, masterclasses and the key readings, but you are welcome to include also additional materials if you wish.
-
-