MAR-E1032 - Digital Landscape Architecture and Urbanism, Studio D, 04.03.2021-27.05.2021
This course space end date is set to 27.05.2021 Search Courses: MAR-E1032
Skill Building Assignment 1: Data Visualisation
This is a group task, however, it would be great if each group member submits a variation of the visualisation created as a group.
The aim is to get hold of a dataset relevant to the group theme and visualise it in grasshopper. If finding relevant data is proving challenging,
replicate the logic of a pattern and visualise its design space in grasshopper.
The group themes have been added to your Group Miro Board, but feel free to deviate from the suggestions.
Deliverables; Submit the gh_script and either images, GIFs or Video of the resulting visualisation. Reference any data that has been used for the visualisation.
Example;

Bike cycling heatmap - app data from cyclists converted into a heatmap using OSM(Open Street Map) data. Finland has open data available here:
https://tiedostopalvelu.maanmittauslaitos.fi/tp/kartta?lang=en
and here;
Reference for inspiration;
http://www.visualcomplexity.com/vc/
Importing data in grasshopper;
If the data happens to be a csv the read file component can import them.

For excel or databases, you can use Lunchbox.

If the data is an image the "image sampler" can be used to get specific pixel data from that image.
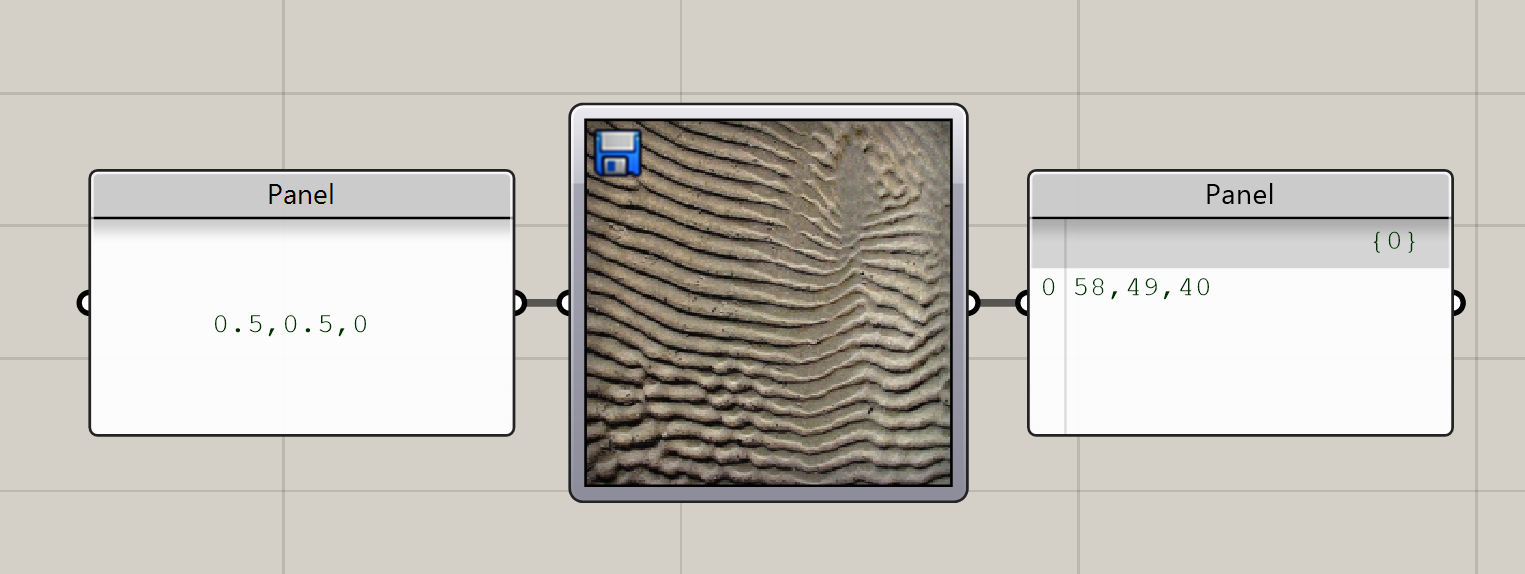
You can choose which colour, alpha, brightness channel to sample the image accordingly. One use case example is to sample tiff files for depth information.