CHEM-E4175 - Fundamental Electrochemistry, 09.01.2019-18.02.2019
This course space end date is set to 18.02.2019 Search Courses: CHEM-E4175
Kirja
4. Electrochemical cells
4.5. Pourbaix diagram
As is clear by now, standard potentials can be used to deduce the direction of redox reactions. Corrosion of metals often involves acid-base reactions coupled with redox reactions. The thermodynamic treatment of corrosion often involves the dependence of reactions on the equilibrium potential and pH. This is presented in a graphic form known as the Pourbaix diagram. It is an isothermic equilibrium diagram, usually presented at 25 °C. The vertical axis is the thermodynamic equilibrium potential on the standard hydrogen electrode scale and the horizontal axis is the pH of the solution in contact with the metal phase. Ionic concentrations have usually been fixed to 10-6 M. Figure 4.4 presents the Pourbaix diagram of iron. The thermodynamically stable species is marked on each zone of the diagram. The lines are defined by electrochemical or acid-base equilibria of the species present. The upper dashed line is the equilibrium potential of the oxygen electrode and the lower dashed line that of the hydrogen electrode, i.e. they represent the potential limits at which the oxygen and hydrogen evolution reactions begin to occur.
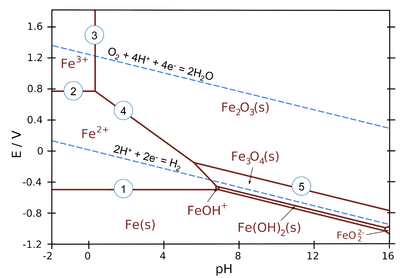
Figure 4.4. Pourbaix diagram of iron. T = 25ºC and ionic concentrations 10–3 M. Source: https://chem.libretexts.org/
The horizontal lines describe pH independent equilibria. For example, line 1 is the equilibrium Fe2+ + 2 e– \(\rightleftharpoons \) Fe which is dependent on potential according to the Nernst equation
| \( \displaystyle E=E_{\text{Fe}^{2+}/\text{Fe}}^0+ \frac{RT}{2F} ln\left(c_{\text{Fe}^{2+}}\right) \) | (4.47) |
|---|
Inserting values into the Nernst equation gives E = –0.53 V, which is the expression corresponding to line 1.
Vertical lines represent pH-dependent equilibria with no electron transfer (i.e. they are independent of potential). For example, line 3 represents equilibrium
2 Fe3+ + 3 H2O \( \rightleftharpoons \) Fe2O3(s) + 6 H+
with equilibrium constant
| \( \displaystyle K= \frac{(c_{\text{H}^+})^6}{(c_{\text{Fe}^{3+}})^2} \) | (4.48) |
|---|
and the expression for line 3 is pH = 0.1 because logK = 0.90 and [Fe3+] = 10-3 M.
All sloped lines in the diagram represent equilibria, which are dependent on both potential and pH. For example, line 4 represents equilibrium
Fe2O3(s) + 6 H++ 2e– \( \rightleftharpoons \) 2 Fe2+ + 3 H2O
The Nernst equation for this equilibrium is
| \( \displaystyle E=E_{\text{Fe}_2\text{O}_3/\text{Fe}^{2+}}^0+ \frac{RT}{2F}ln \frac{(c_{\text{H}^+})^6}{(c_{\text{Fe}^{3+}})^2} \) | (4.49) |
|---|
The expression for line 4 is E/V = 0.91 − 0.18·pH.
The Pourbaix diagram includes the equilibrium potentials of hydrogen and oxygen electrodes as dashed lines. The difference between these lines is 1.23 V, which is the thermodynamic dissociation potential of water. Above the oxygen electrode line, water is spontaneously dissociating and oxygen is evolving, below the hydrogen electrode line water is dissociating and hydrogen gas is evolving. Most corrosion reactions take place in the domain between these lines where water is stable.
Assuming that all solid oxides or hydroxides will form a passivating film on the metal surface, the Pourbaix diagram gives the zones where metal should be immune, active (corroding) or passive (not corroding or corroding only very slightly).
A Pourbaix diagram of a metal shows the conditions for the metal to remain passive or immune to the corrosive effects of the environment. The information from the diagram has to be used with caution as it is based purely on thermodynamics. The most important restrictions are
· The assumption of equilibrium between the metal, its ions, and its ions and different solid corrosion products. In practice, equilibrium may not be reached but the kinetics of the corrosion reactions dictates the reaction and the structure of the products.
· The pH-value in the diagram is a surface value. In practice, pH can vary locally and is usually lower on the anode surfaces and higher on the cathode surfaces compared to the value measured from the bulk solution.
· Thermodynamics does not tell the structure of the solid corrosion products, or how well they actually protect the metal from corrosion. Passive zones in the diagram need to be confirmed experimentally.
· The Pourbaix diagram does not provide any information on the rate of corrosion, which is dependent on the kinetics of the corrosion reaction