TU-L0000 - Research Methods in Industrial Engineering and Management D, Lecture, 21.9.2021-7.12.2021
This course space end date is set to 07.12.2021 Search Courses: TU-L0000
Pre-assignment for session #5
Readings
Singleton, R., & Straits, B. C. (2018). Approaches to social research (Sixth edition). New York: Oxford University Press. Chapter 4: Elements of Research Design
Allison, P. D. (1999). Multiple Regression : A Primer. Thousand Oaks, Calif: SAGE Publications, Inc. Chapters 1-2 (The book is available as an ebook at the library)
Deephouse, D. L. (1999). To be different, or to be the same? It’s a question (and theory) of strategic balance. Strategic Management Journal, 20(2), 147–166. doi:10.1002/(SICI)1097-0266(199902)20:2<147::AID-SMJ11>3.0.CO;2-Q
Video materials
Watch the videos in the following YouTube playlist. (About one hour of video material)
Instructions
Read Singleton and Straits (2018) chapter on research design with thought and skim through the other materials. Then watch the video material. Write down any questions or thoughts that might arise from the materials and be prepared to discuss these in the seminar.
After you have done studying the materials, answer the questions. When answering the questions, ignore Model 3 in Table 2 and all other results about non-linear effects.
Questions
Part 1: Deephouse makes a causal proposition “Less strategic similarity increases performance” and performs a quantitative study to assess whether the claim is justified. Explain how the three conditions for causality, as discussed by Singleton and Straits (2018), are taken into consideration in the study. Do you think that a causal claim is justified in this case? Considering the evidence presented in Table 1 and Table 2.
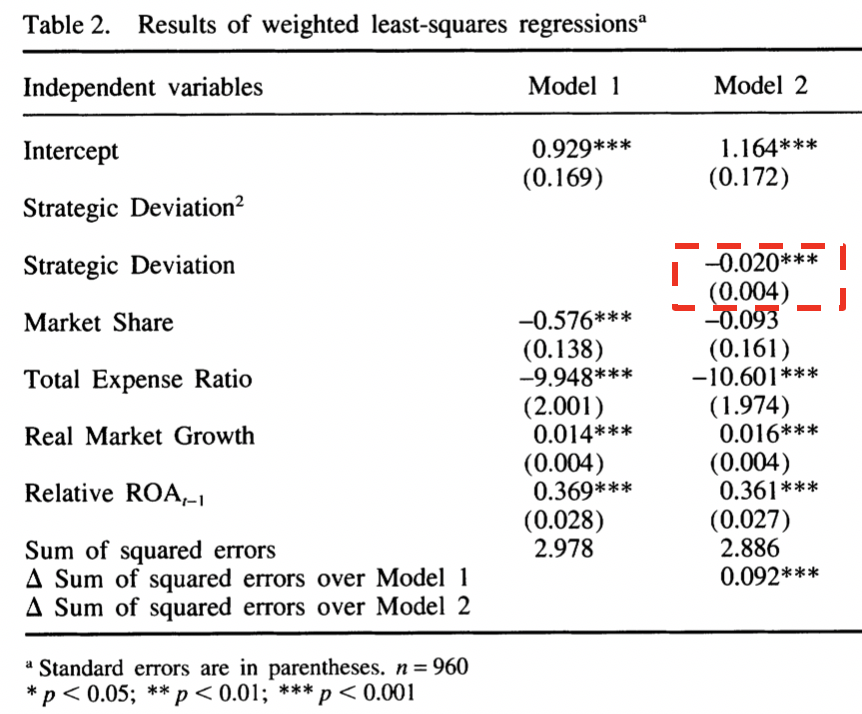
Part 2: Consider the evidence presented in Deephouse’s Table 2 reproduced below. Why are there two models in the table? Consider the regression coefficient marked with a red box: Table 1 presents a corresponding correlation. What is the value of this correlation and why do you think it is different from the regression coefficient? Interpret the regression coefficient: is the effect of strategic deviation on relative ROA large or small? Chapter 2 from Allison (1999) explains the interpretation of regression tables like this with multiple examples.

Please answer the questions in English. Your answer should be about 2 pages.
Readings
Singleton, R., & Straits, B. C. (2018). Approaches to social research (Sixth edition). New York: Oxford University Press. Chapter 4: Elements of Research Design
Allison, P. D. (1999). Multiple Regression : A Primer. Thousand Oaks, Calif: SAGE Publications, Inc. Chapters 1-2 (The book is available as an ebook at the library)
Deephouse, D. L. (1999). To be different, or to be the same? It’s a question (and theory) of strategic balance. Strategic Management Journal, 20(2), 147–166. doi:10.1002/(SICI)1097-0266(199902)20:2<147::AID-SMJ11>3.0.CO;2-Q
Video materials
Watch the videos in the following YouTube playlist. (About one hour of video material)
Instructions
Read Singleton and Straits (2018) chapter on research design with thought and skim through the other materials. Then watch the video material. Write down any questions or thoughts that might arise from the materials and be prepared to discuss these in the seminar.
After you have done studying the materials, answer the questions. When answering the questions, ignore Model 3 in Table 2 and all other results about non-linear effects.
Questions
Part 1: Deephouse makes a causal proposition “Less strategic similarity increases performance” and performs a quantitative study to assess whether the claim is justified. Explain how the three conditions for causality, as discussed by Singleton and Straits (2018), are taken into consideration in the study. Do you think that a causal claim is justified in this case? Considering the evidence presented in Table 1 and Table 2.
Part 2: Consider the evidence presented in Deephouse’s Table 2 reproduced below. Why are there two models in the table? Consider the regression coefficient marked with a red box: Table 1 presents a corresponding correlation. What is the value of this correlation and why do you think it is different from the regression coefficient? Interpret the regression coefficient: is the effect of strategic deviation on relative ROA large or small? Chapter 2 from Allison (1999) explains the interpretation of regression tables like this with multiple examples.

Please answer the questions in English. Your answer should be about 2 pages.
Sorry, no guest users are allowed to access this plugin. Please login.
