WAT Computational Methods
Topic outline
-
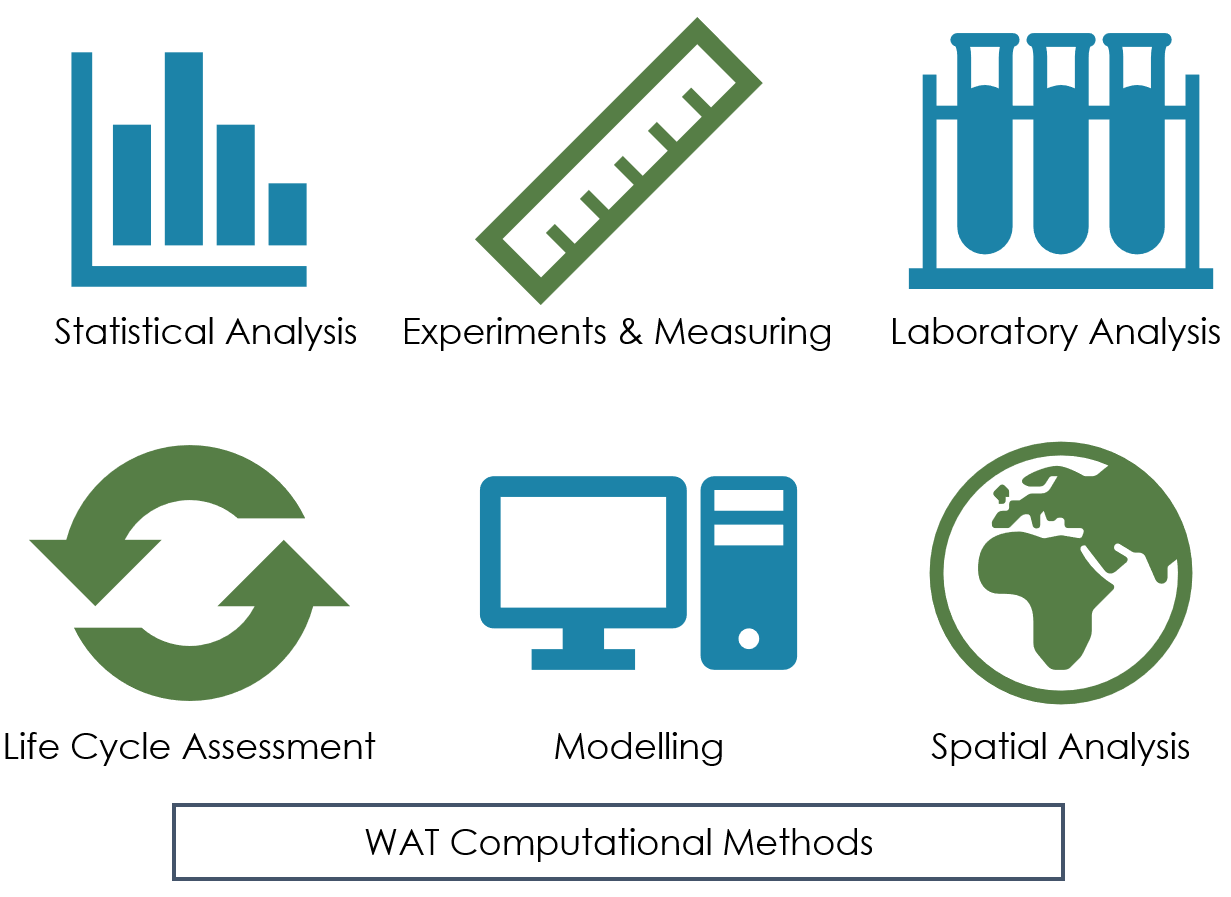
These MyCourses pages provide you an overview of the selected computational methods that are relevant to the water and environmental engineering field. The page thus helps you to get orientated with your WAT Master's studies.
The methods will be dealt in more depth during your studies, particularly during 15-credit WAT-E1100 Water and Environmental Engineering course that you will take at the beginning of your studies. This page thus helps you to understand what to expect from that course, and enables you to familiarize in our field's key methods already beforehand. Each subpage goes through the main aspects of one of the key methods, and also lists some WAT Master's courses or other courses and material where the method will be further dealt with.
For more information on our Master's Programme in Water and Environmental Engineering (WAT), please see: https://www.aalto.fi/en/programmes/masters-programme-in-water-and-environmental-engineering
Remember also to check Aalto’s webpage for new Master’s students (click here) as well as Aalto's Pre-orientation course (click here) in MyCourses.
-
Statistics provides tools to collect, organize and present as well as understand large datasets by interpreting and analyzing them. Statistical methods can be used to make conclusions based on numerical and quantitative data. Statistical analysis has close linkages with probability calculus, especially in cases where there is uncertainty and randomness in the dataset. Some key concepts that come up in statistics include various measures depicting middle point or spread of a dataset, different distributions, and hypothesis testing.
One typical example of statistical analysis is related to correlation analysis and linear regression. We are often interested in investigating relationships and dependency of different variables and seeing how changes in one variable (independent variable) relate to changes in the other (dependent variable). A typical model used to describe the relationship is a linear model, which is a line in the case of two variables. To draw conclusions of the variable dependency, the relationship of variables is converted into a mathematical model and its significance and accuracy are diagnosed. Linear regression can be used, for example, to investigate how GDP affects life expectancy or how population distribution is related to the distance to coast.
There are various tools and programs that can be used for statistical analysis, such as Matlab, SPSS and R. We will use R during the introductory WAT-E1100 course that builds on former WAT-E1030 course. If you want, you can familiarize yourself with it beforehand, for example here, but instructions and tutoring will be provided during the course.
-
Simulation models aim to describe a real world system in a mathematical representation. They enable analysis of the system behavior by running the computational code on a computer and examining the results. With models, it is possible to make predictions and examine systems of different scales. Some example uses in the field of water and environmental engineering are given in the figure below.
Even though modelling has many different applications, it has common concepts that most of simulation models share.
Models have state variables that, as the name suggests, describe the state of a system, which could be, for example, flow velocity, water pressure, groundwater level or pollutant concentration. Model parameters, on the other hand, are variables used to describe the behavior of the system. Examples include hydraulic conductivity, dispersion coefficient, friction coefficient and degree-day factor, and usually, parameter values remain constant in time.
Time dependent models often need information about the initial state of the system. Boundary conditions describe how the modelled system interacts with the surrounding world at its boundaries.
Calibration and validation are important key concepts in modelling. Calibration means the optimization of the model by changing parameter values so that the error between model output and measured data is minimized, i.e. the model describes the real world system as closely as possible. However, since calibration based on the given calibration dataset, the performance of the model needs to be checked also for other independent data. This is called model validation and it checks how well the calibrated model works outside the calibration data.
Some of the modelling software are designed for a specific type of use (e.g. water distribution network modelling) while others are more generic platforms providing scripting, computational libraries and visualization tools to facilitate tailored model development. Widely used platforms include e.g. Excel, Matlab, R and Python.
-
The geographical location is often essential when analyzing problems related to water and environmental engineering. GIS (Geographic Information System) is a system for storing, analyzing and visualizing geographical information. Geographical information consists of two parts: information about some phenomena, object or feature (such as agricultural land area or buildings) and geographical location defined by coordinates.
Geographic data can be stored and analyzed in raster or vector format. In the raster representation the studied area is divided into a grid of regular rectangles and each of these grid cells has its own value for the phenomena being described. Vector data, on the other hand, is based on a set of points represented by x,y coordinate pairs along with the information how these points are connected. Depending on the connectivity between the points, such data can represent different shapes points, lines, or polygons. Each shape can be associated with attribute information, e.g. if a point represents the location of a city, the attribute information could include the name of the city, the population, and the area.
In spatial analysis, the geographical datasets are often analyzed by comparing several datasets to each other. For example, it is possible to estimate the number of people living outside municipal water networks by comparing a dataset of residential buildings and a dataset of municipal water networks. Spatial analysis can also be used to summarize information on a larger scale, for example calculating the fraction of agricultural land in a specific region. -
While life cycle assessment (LCA) is not in the core of our research at Water and Environmental Engineering Research Group, it is still very relevant approach to our field. LCA is used to assess environmental impacts of different subjects, such as products, services, processes and economic activities. They can also be used as a basis for reducing the environmental impacts, for example by highlighting the problem areas and finding alternatives for the causes. As such, LCA forms one important general approach for our field, although we currently don't have specific LCA courses in our WAT Master's Programme (except the pilot course done in collaboration with KTH).
The core idea of a LCA is to look at the complete life cycle of a subject and both identify and quantify the different sources of environmental loads. There exists many different types of LCAs, some compare different products to each other and can be more simplified while others investigate the life cycle of one product in high detail and accuracy, some describe the current situation while others focus on capturing consequences of decisions. LCAs can be constructed based on processes when there is detailed data available but they can also be based on input-output data.
The figure below describes the way to conduct a LCA based on the international standard ISO-14040. -
In contrast to many methods, laboratory analysis is strongly qualitative instead of quantitative. Laboratory work focuses on analysing qualitative characteristics of a specific subject. In the case of water, the aim is to know the contents and parameters of the water and the analysis could be targeted for example at pH, hardness, turbidity or electrical conductivity. This is the specialization of our water laboratory.
In laboratory work, the repeatability of the analysis is utmost important and required for reliable results. Therefore, laboratory analyses are based on different standards that define in close detail how the analysis is to be carried out. Good laboratory work practises also include documentation and reporting. During the WAT-E1030, you will get hands-on experience with several laboratory analyses.
Laboratory as an working environment requires its own attention and carefulness. There are irritating, toxic and flammable materials present and it is required to take necessary precautions. Before working in the lab, everyone has to familiarize themselves with the rules and guidelines for safe laboratory work and pass the laboratory safety exam.
Example of WAT courses:
WAT-E2120 Physical and Chemical Treatment of Water and WasteOther:
CHEM-E0140 Laboratory Safety Course
Occupational safety, AaltoCHEM
-
Not everything can be modeled or simulated and assessed in an abstract way but sometimes practical work is needed to get information on some phenomenon. In these cases, measurements become increasingly relevant to express characteristics and relations in quantitative terms. These cases could rise, for example, due to too complex physical settings or too many unknown parameter values or processes. Moreover, experiments and measurements allow testing hypotheses. Additionally, measurements have a close relation to modelling as the calibration and validation of models require measured datasets.
Experiments and the related measurements require planning and organizing beforehand. First, the objective of the experiment has to be defined as well as the required accuracy and precision. Financial resources and qualified personnel also affect the experiment design. Depending on the measuring environment, different conditions have to be considered, such as water quality, vegetation and weather. Post-processing should also be considered already in the design phase.
Measurements are always open error and uncertainty. Error means the deviation between measured and “true” value, while uncertainty refers to doubt about the validity of the measurement result which is always present when making measurements. Errors can be minimized but they cannot be fully avoided. Errors can be divided to random error caused by random and unpredictable effects and systematic error that’s consistent between different measurements. Uncertainty can be estimated quantitatively with, for example, standard deviation, mean absolute and relative error and coefficient of variation.
During the WAT-E1030 course, the these methods of experimental research are explored using the hydraulic flume in Environmental Hydraulics Lab.
Example of WAT courses:
WAT-E2020 Environmental Hydraulics